
Monitor & Optimize
Flower Model Report
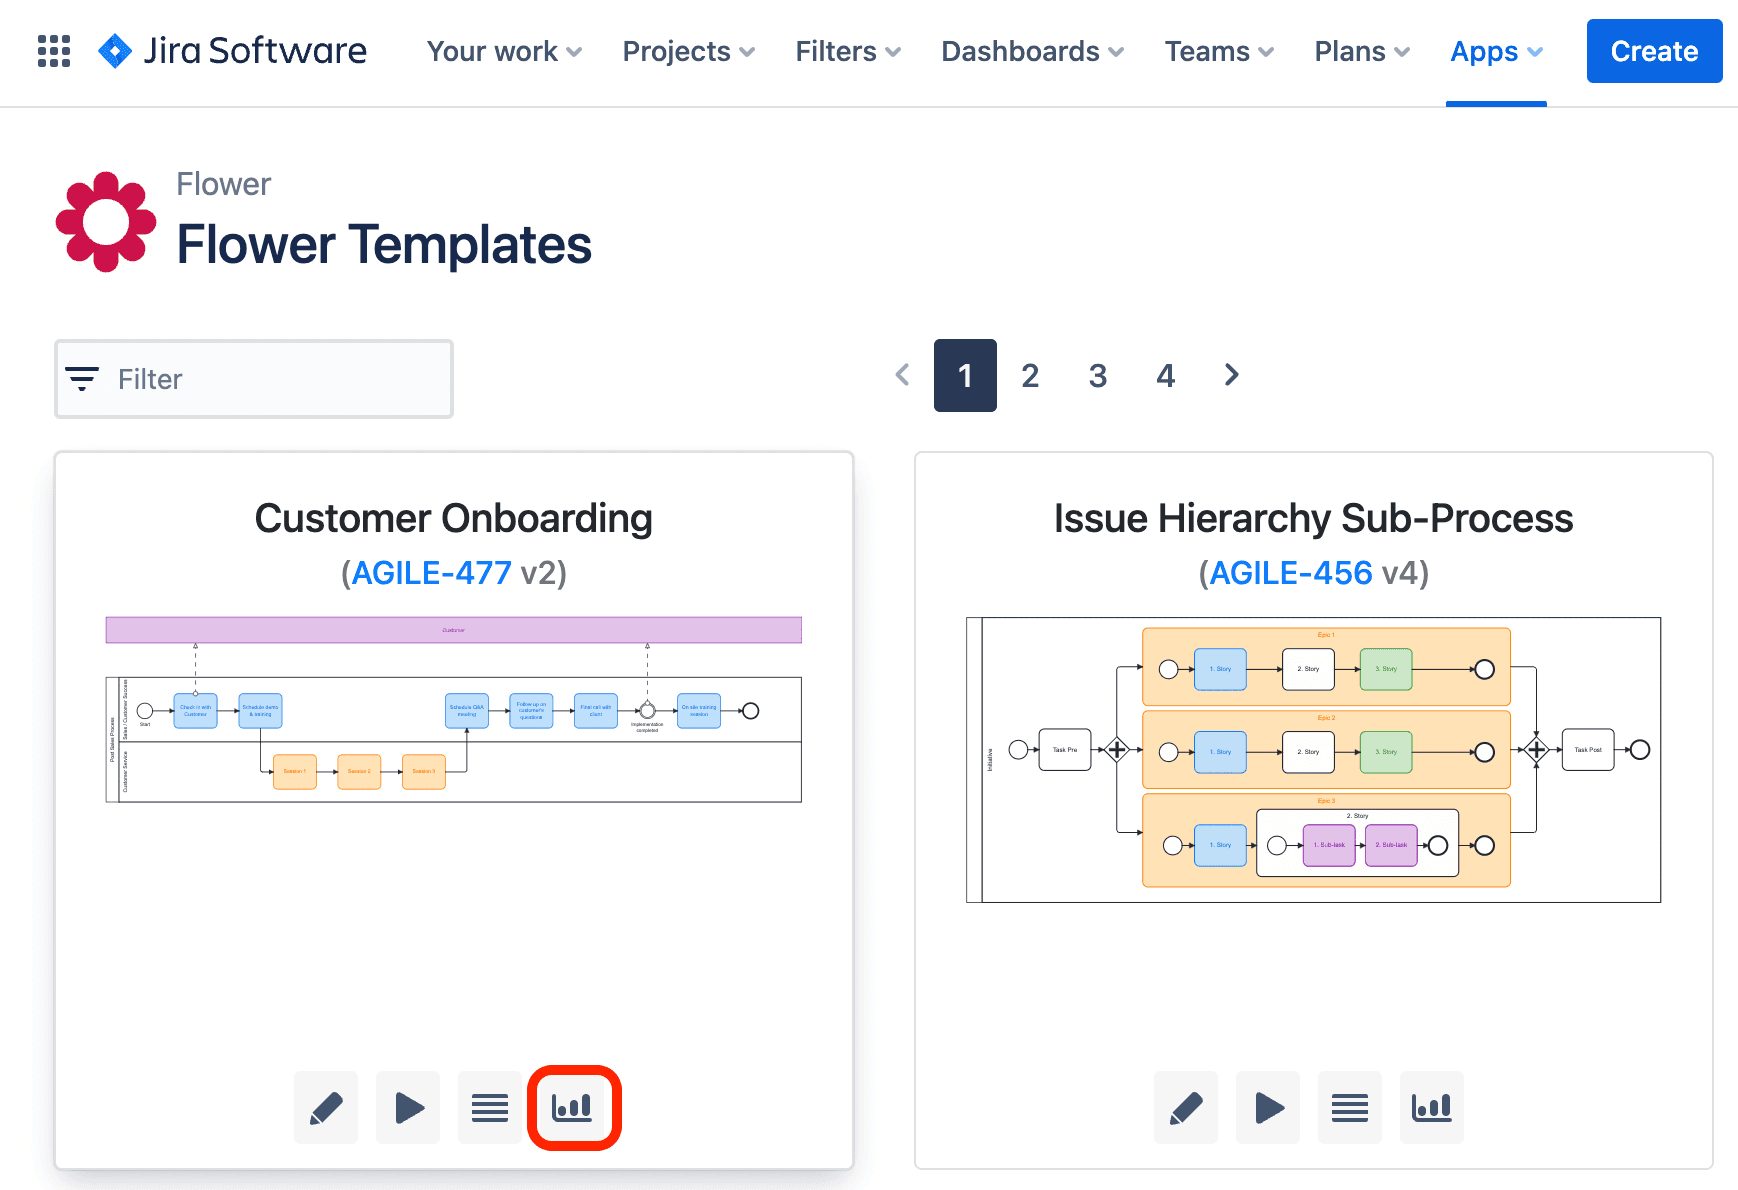
As a process owner, you may need a quick real-time overview of all your running process instances. To do this, click on the reporting icon on your flower model card:
Task Count per Node
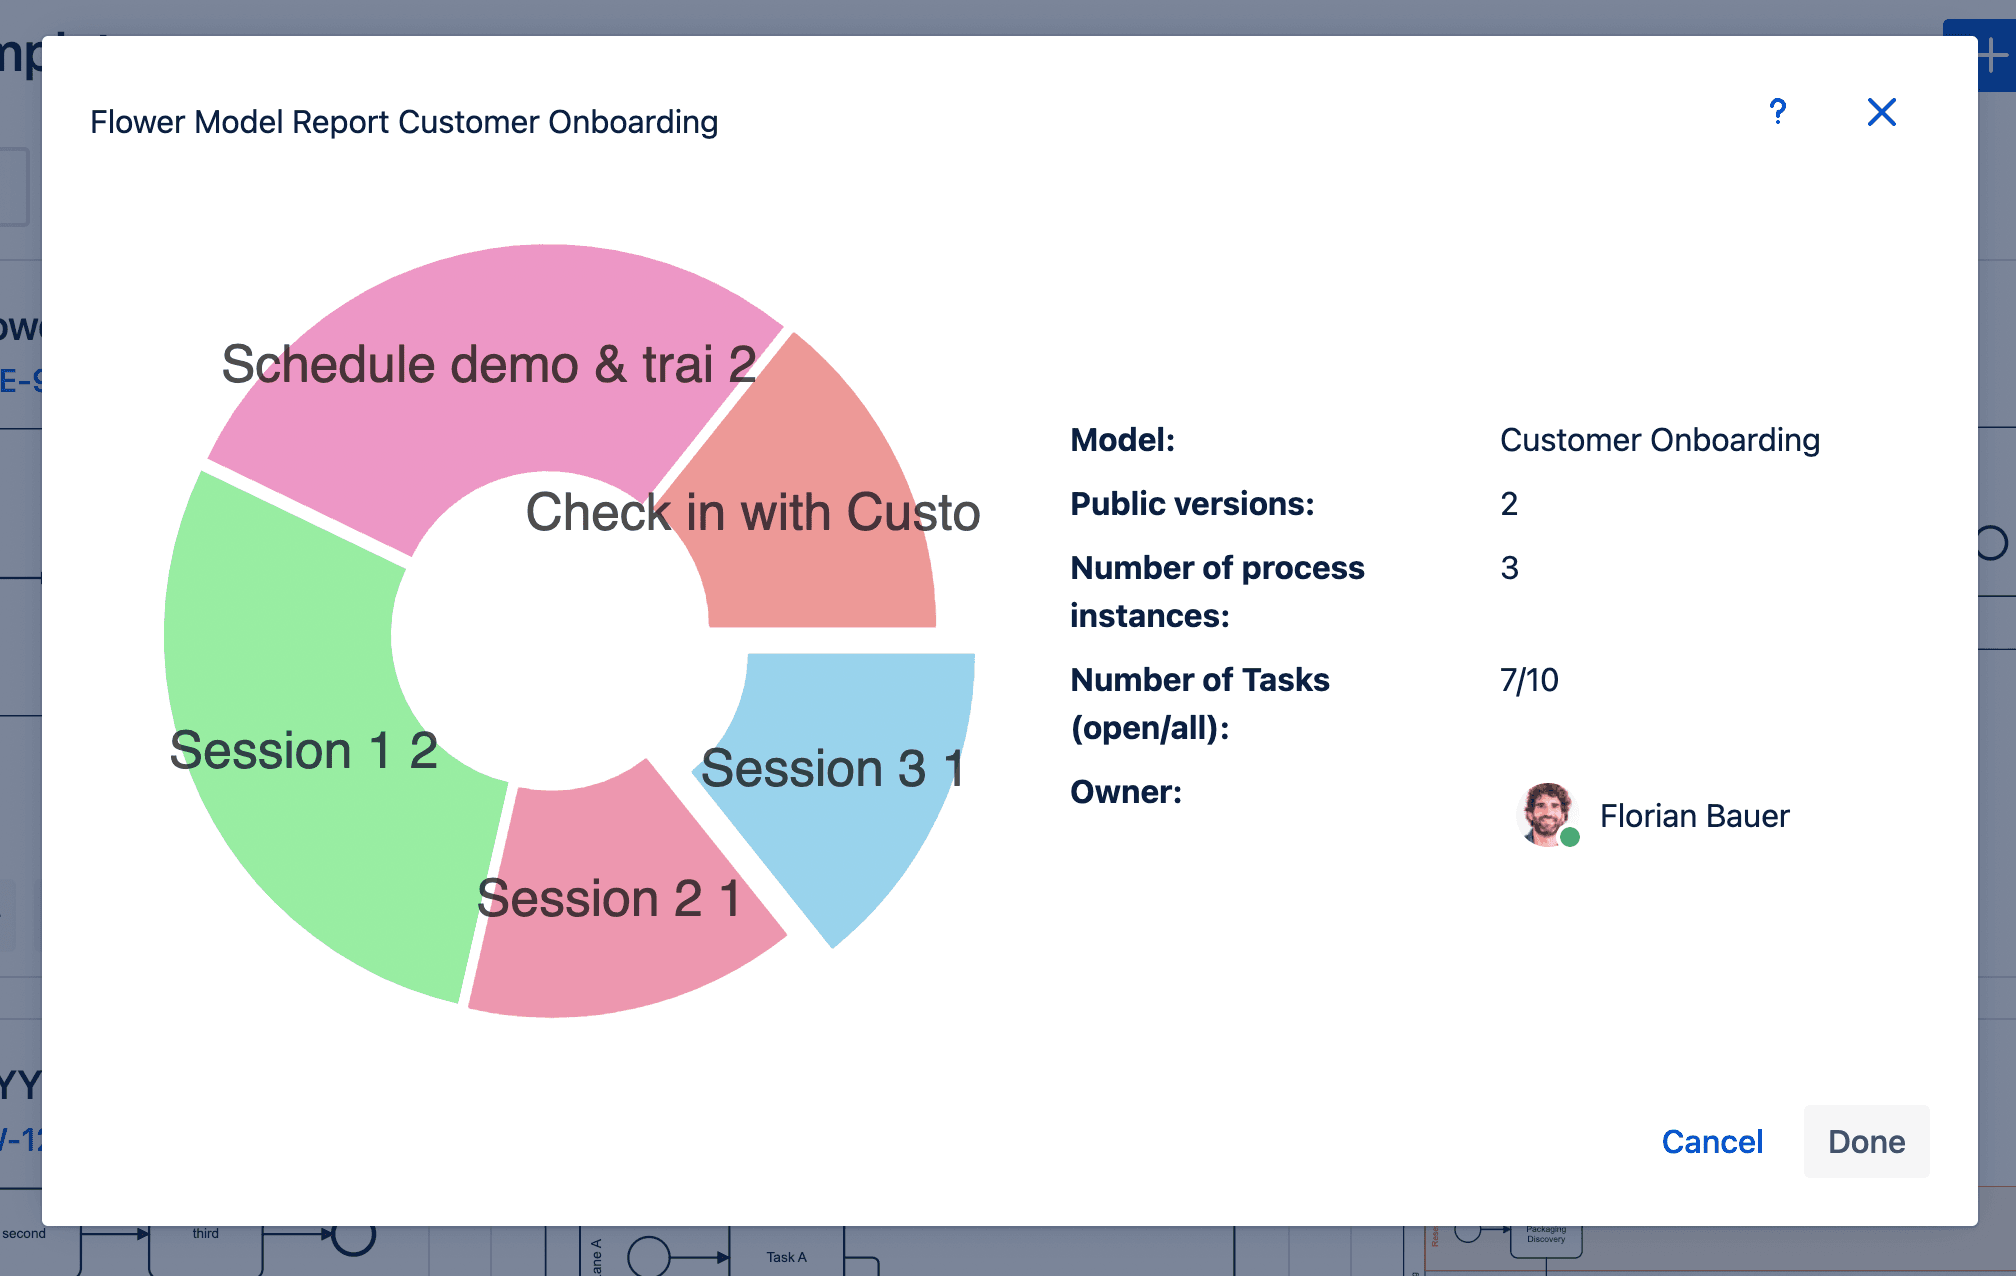
This opens a modal window with a flower model report. In addition to the number of open, completed tasks or process instances, you will find a pie chart, which shows the distribution of all open Jira issues to activities in the current flower model. Each slice of the pie represents the number of open issues per activity.
Further more, you can also access your Flower processes with all Jira report-gagets or even reporting apps from the Marketplace. This is because all Flower entities can be addressed via JQL.