
Monitor & Optimize
Gain Insights into Your BPMN Processes
Monitor & Optimize
Process automation is not just about execution—it is also about tracking, analyzing, and optimizing your workflows.
Flower gives you a built-in report for a quick overview and works with all of Jira’s reporting tools for deeper analysis.
Built-in Model Report
For a quick real-time overview of all running process instances of a model, open the model report.
Click the reporting icon on the BPMN model card:
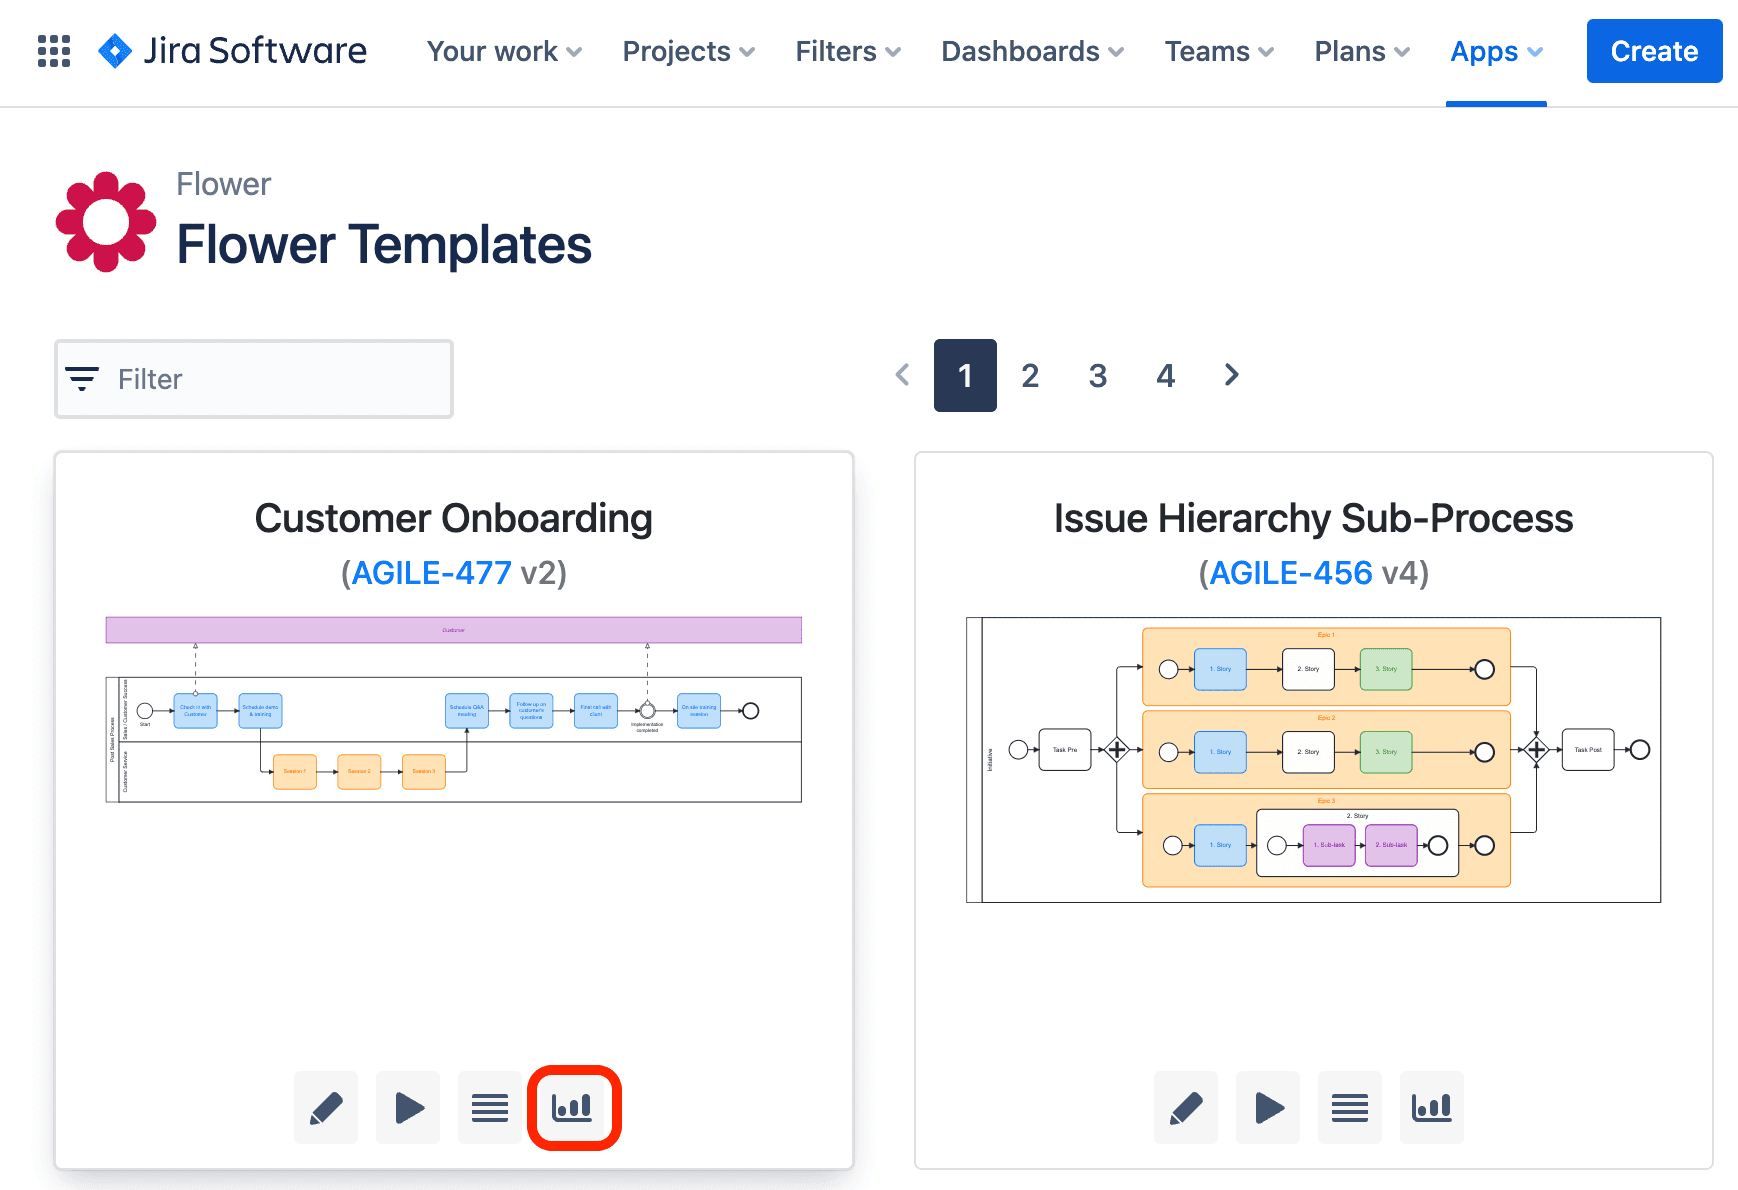
A window opens with the key figures of the model:
- The number of open and completed process instances
- The number of open work items per BPMN activity, shown as a pie chart
Open Work Items per BPMN Activity
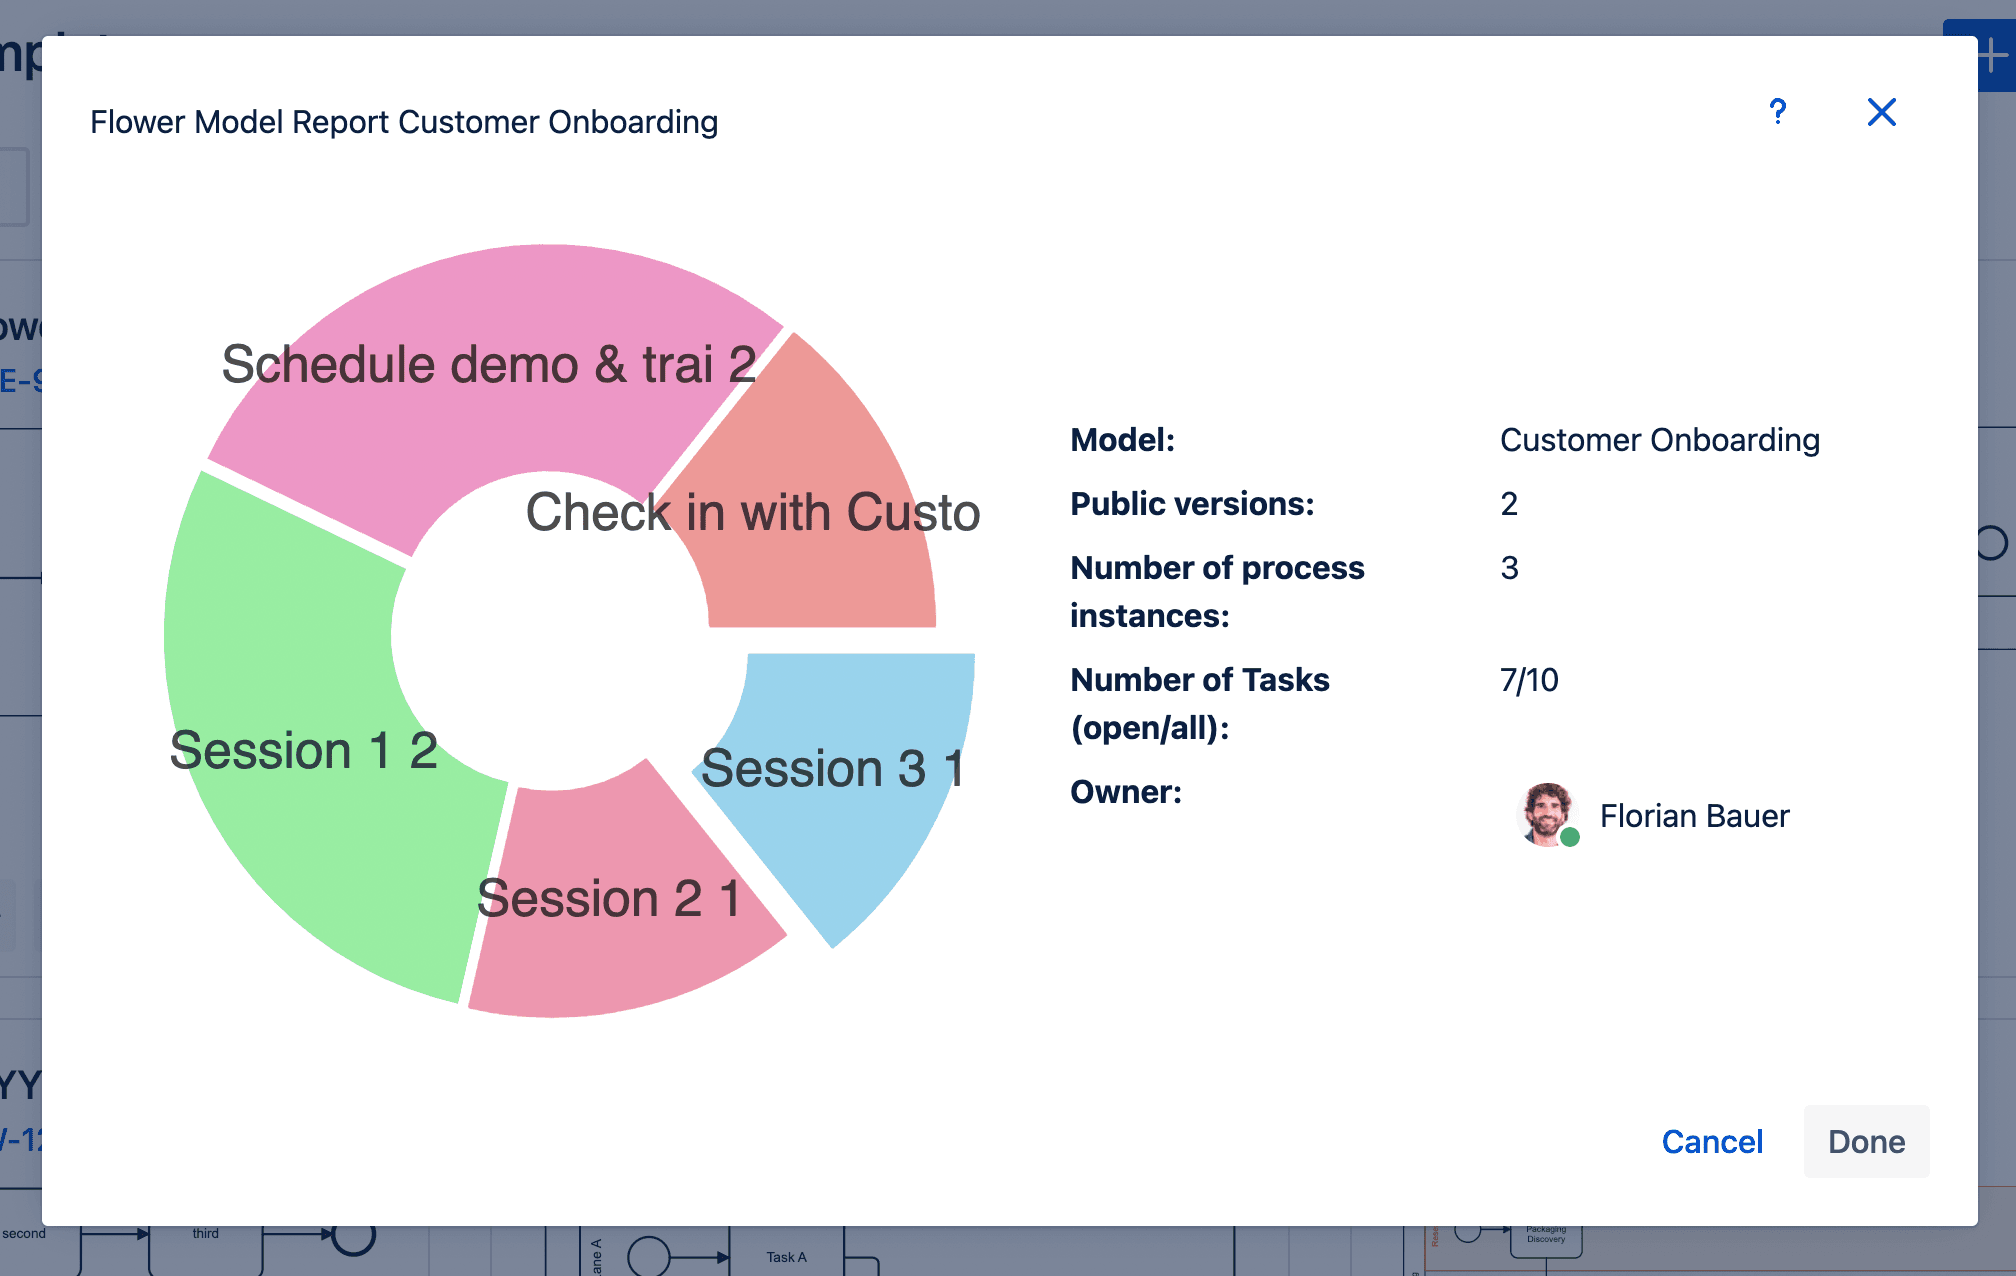
Each slice of the pie chart shows the number of open Jira work items at a BPMN activity.
Use it to spot bottlenecks: if many work items pile up at one activity, that is where your process slows down.
Advanced Reporting with Jira
Beyond the built-in report, you can analyze Flower processes with all of Jira’s reporting tools.
Models, process instances, and activities are Jira work items, so you can find them with JQL and use them in filters, reports, and dashboards.
Find Process Data with JQL
These two queries find the running process instances and the open work items of a model:
flowerType = "Process Instance" AND flowerModel = YOUR-MODEL-KEY AND resolution is EMPTY
flowerType = Activity AND flowerModel = YOUR-MODEL-KEY AND resolution is EMPTY
See Search Flower Data with JQL for all search fields and more queries.
Use Jira’s Reports
Save a JQL query as a filter, then use it in Jira’s reports and dashboards.
In the Reports tab of the space where Flower creates your work items, you will find reports such as:
- Created vs Resolved Work Items Report: Shows how many work items are created and resolved over time, a measure of your process throughput.
- Resolution Time Report: Shows how long it takes to resolve a set of work items.
- Control Chart: Shows the cycle time and lead time of your work items and helps you find inefficiencies.
You can also add dashboards with gadgets based on your filters, or use Marketplace apps for advanced analytics, for example time in status.
Example: How Long Does a Swimlane Take?
- Create a filter for the work items of a swimlane, for example
flowerLane = "Finance" AND flowerModel = YOUR-MODEL-KEY. - Open the Resolution Time Report and select your filter.
- Repeat this for other swimlanes to see where work takes the longest.
Summary
- Flower provides a built-in model report with the number of open work items per BPMN activity.
- Models, process instances, and activities are Jira work items, so JQL filters find them.
- Jira’s reports and dashboards work with Flower data like with any other work items.
- Marketplace apps extend reporting for deeper insights.
By combining Flower’s model report with Jira’s reporting tools, you can continuously monitor, optimize, and improve your business processes.
What’s Next?
- JQL Queries: Find every Flower entity with JQL.
- Get Started with Automation: Run your model as a process and track it in Jira.